

Hyperspectral Imaging: Technology, Applications & AI-Based Analysis

Making the Invisible Visible
Some problems are invisible until it’s too late — contamination in your food line, moisture in your grain, plastic mixed into your recycling stream. Hyperspectral imaging sees the chemistry your eyes and cameras can’t, so you can catch it before it becomes a costly mistake.
What Is Hyperspectral Imaging?
Hyperspectral imaging (HSI) captures information far beyond what traditional cameras can see, collecting data across hundreds of wavelengths to reveal the composition and condition of materials in detail.
If you already use machine vision or lab-based chemical testing, think of hyperspectral imaging as combining the two — visual inspection speed with laboratory-grade chemical insight.
In practice, that means you can spot a contaminant a camera would miss, verify a product’s composition without destroying the sample, and catch quality problems in seconds instead of hours in a lab.
Often described as “making the invisible visible,” hyperspectral imaging reveals differences that cannot be detected by the human eye or conventional imaging systems.
Hyperspectral vs. RGB vs. Multispectral
Traditional RGB cameras capture three colour channels. Multispectral cameras add a handful more — typically 4 to 20 discrete bands. Hyperspectral imaging goes further still, capturing a continuous spectrum of 100 to 1,000+ bands for every pixel, which is what makes it possible to detect subtle chemical differences the other two miss.
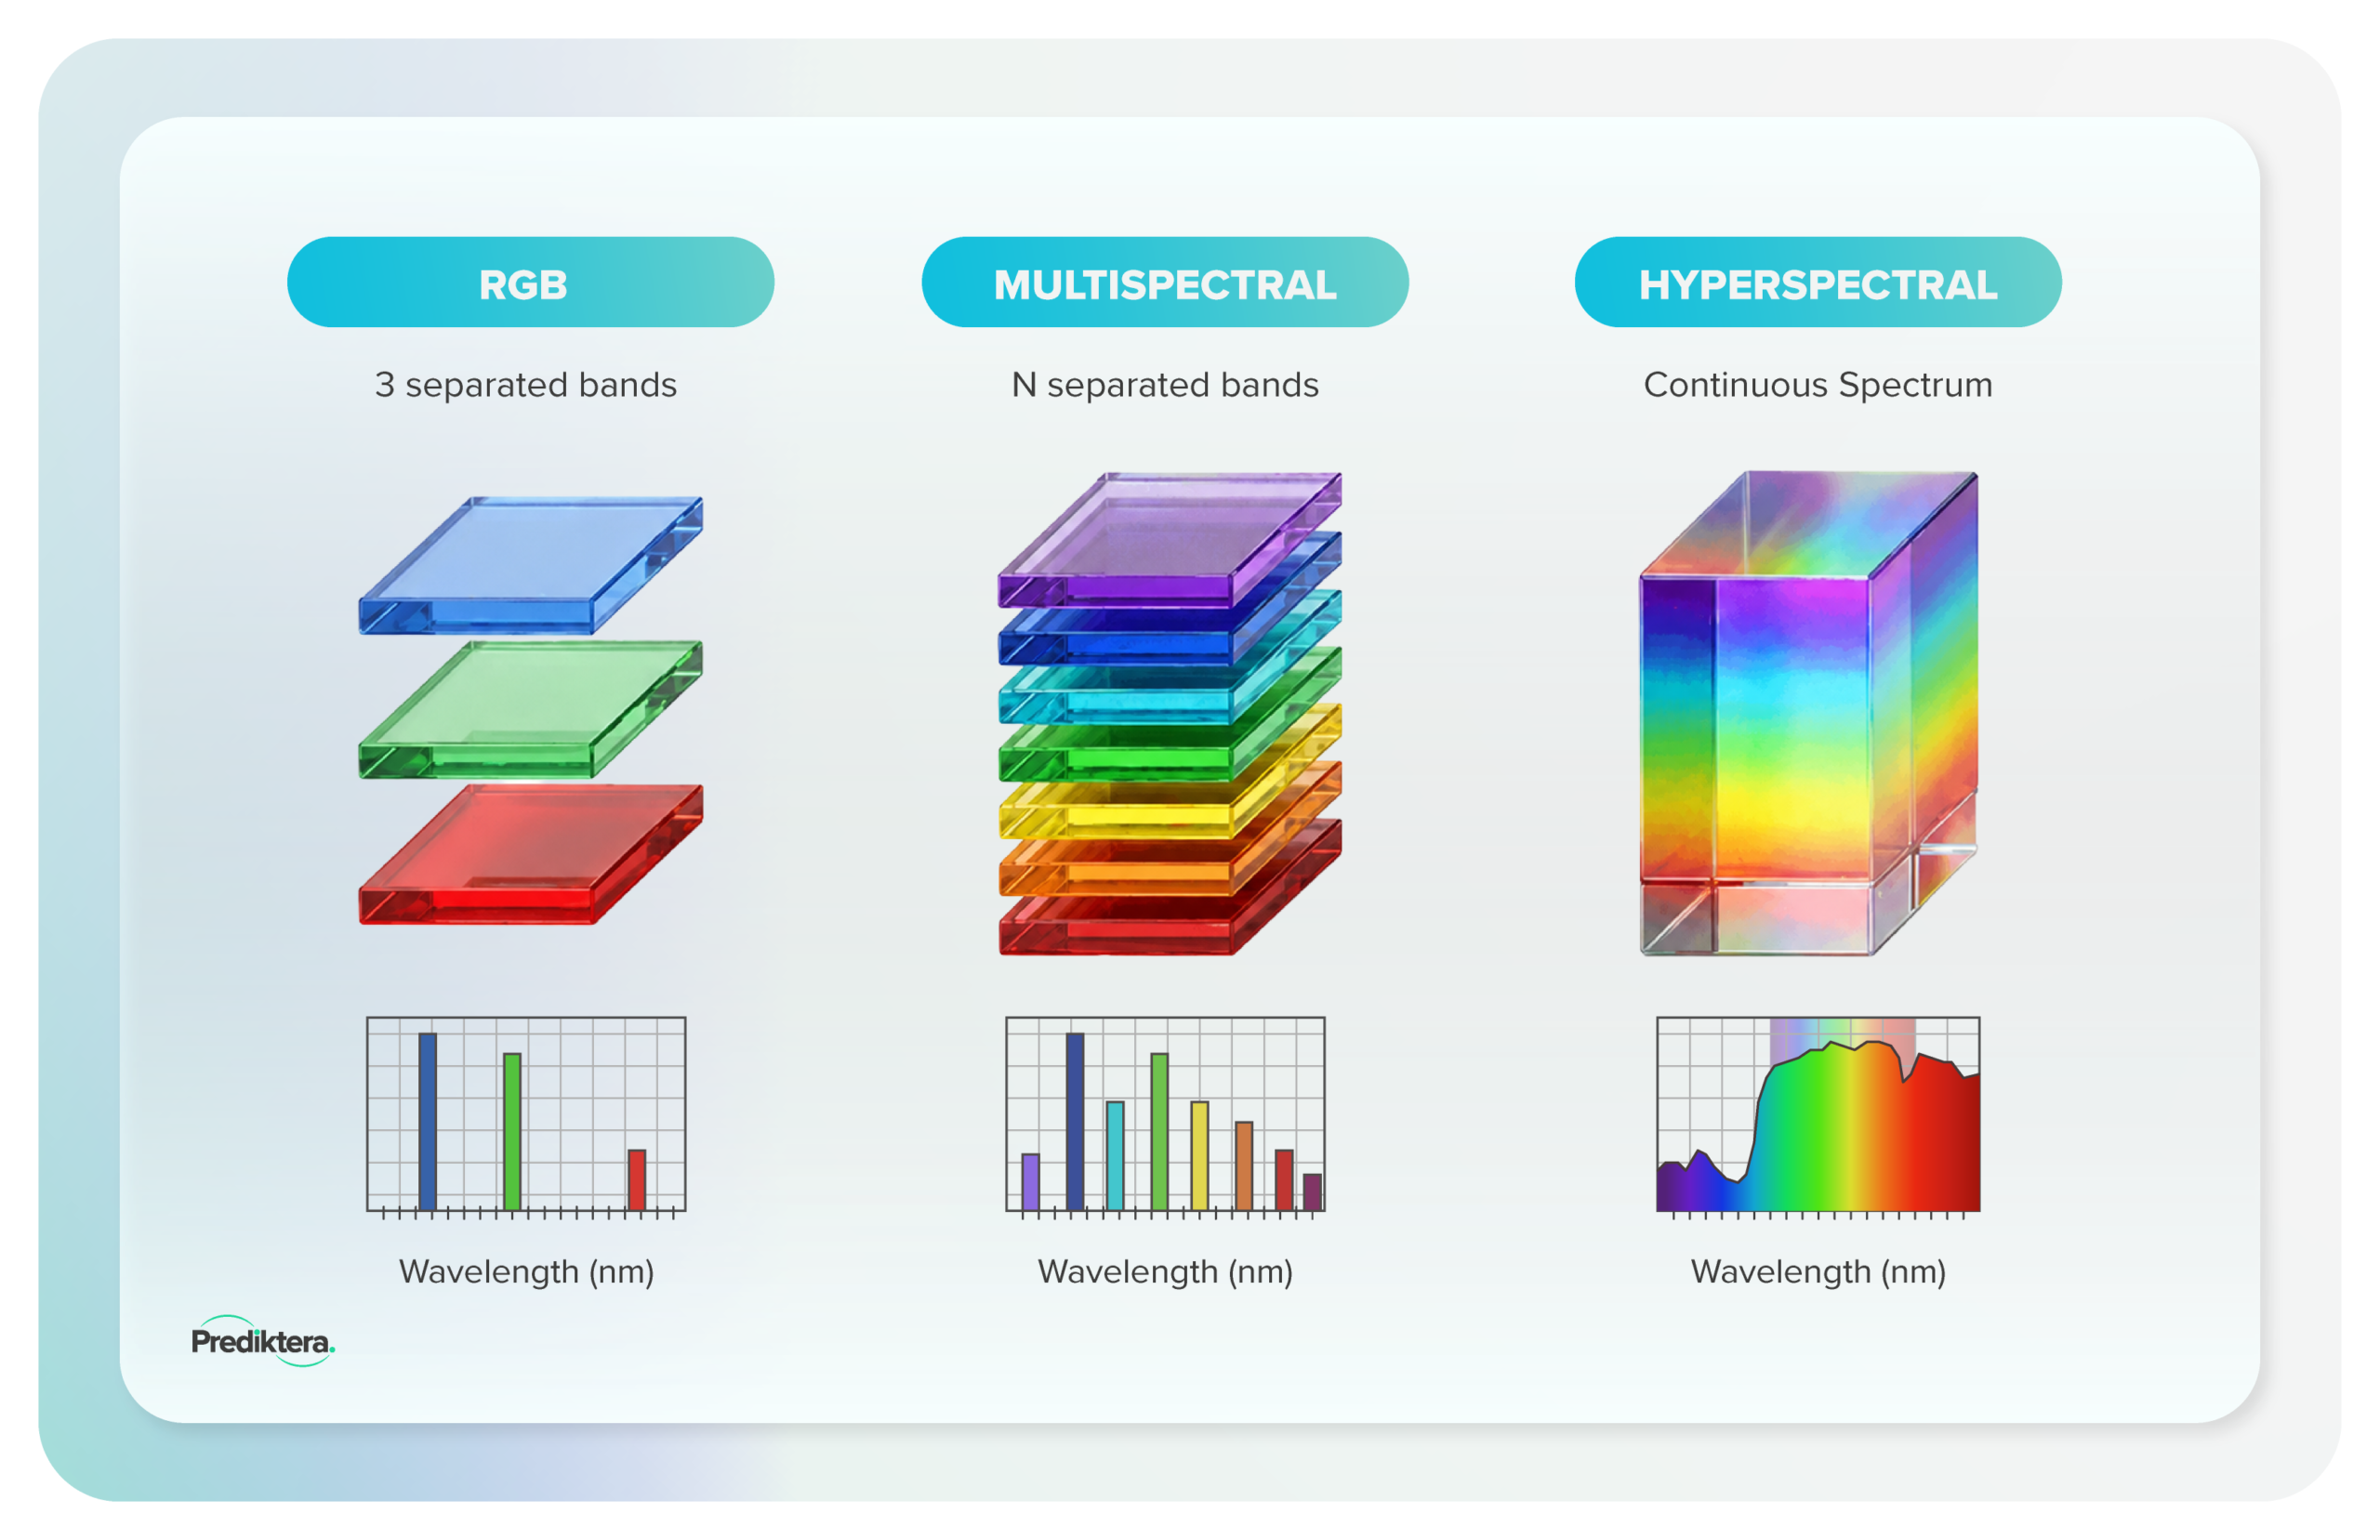
Feature | RGB | Multispectral | Hyperspectral |
Bands | 3 | 4–20 discrete bands | 100–1,000+ continuous bands |
Spectral Resolution | Low | Low | High |
Data Volume | Low | Moderate | Very High |
How Hyperspectral Imaging Works
Light and Material Interaction
Every material interacts with light in a unique way. Some wavelengths are absorbed while others are reflected, creating a distinct spectral signature. Think of it like a fingerprint: every plastic, grain, mineral, or pharmaceutical ingredient reflects and absorbs light in a pattern that’s uniquely its own — even when it looks identical to the human eye.
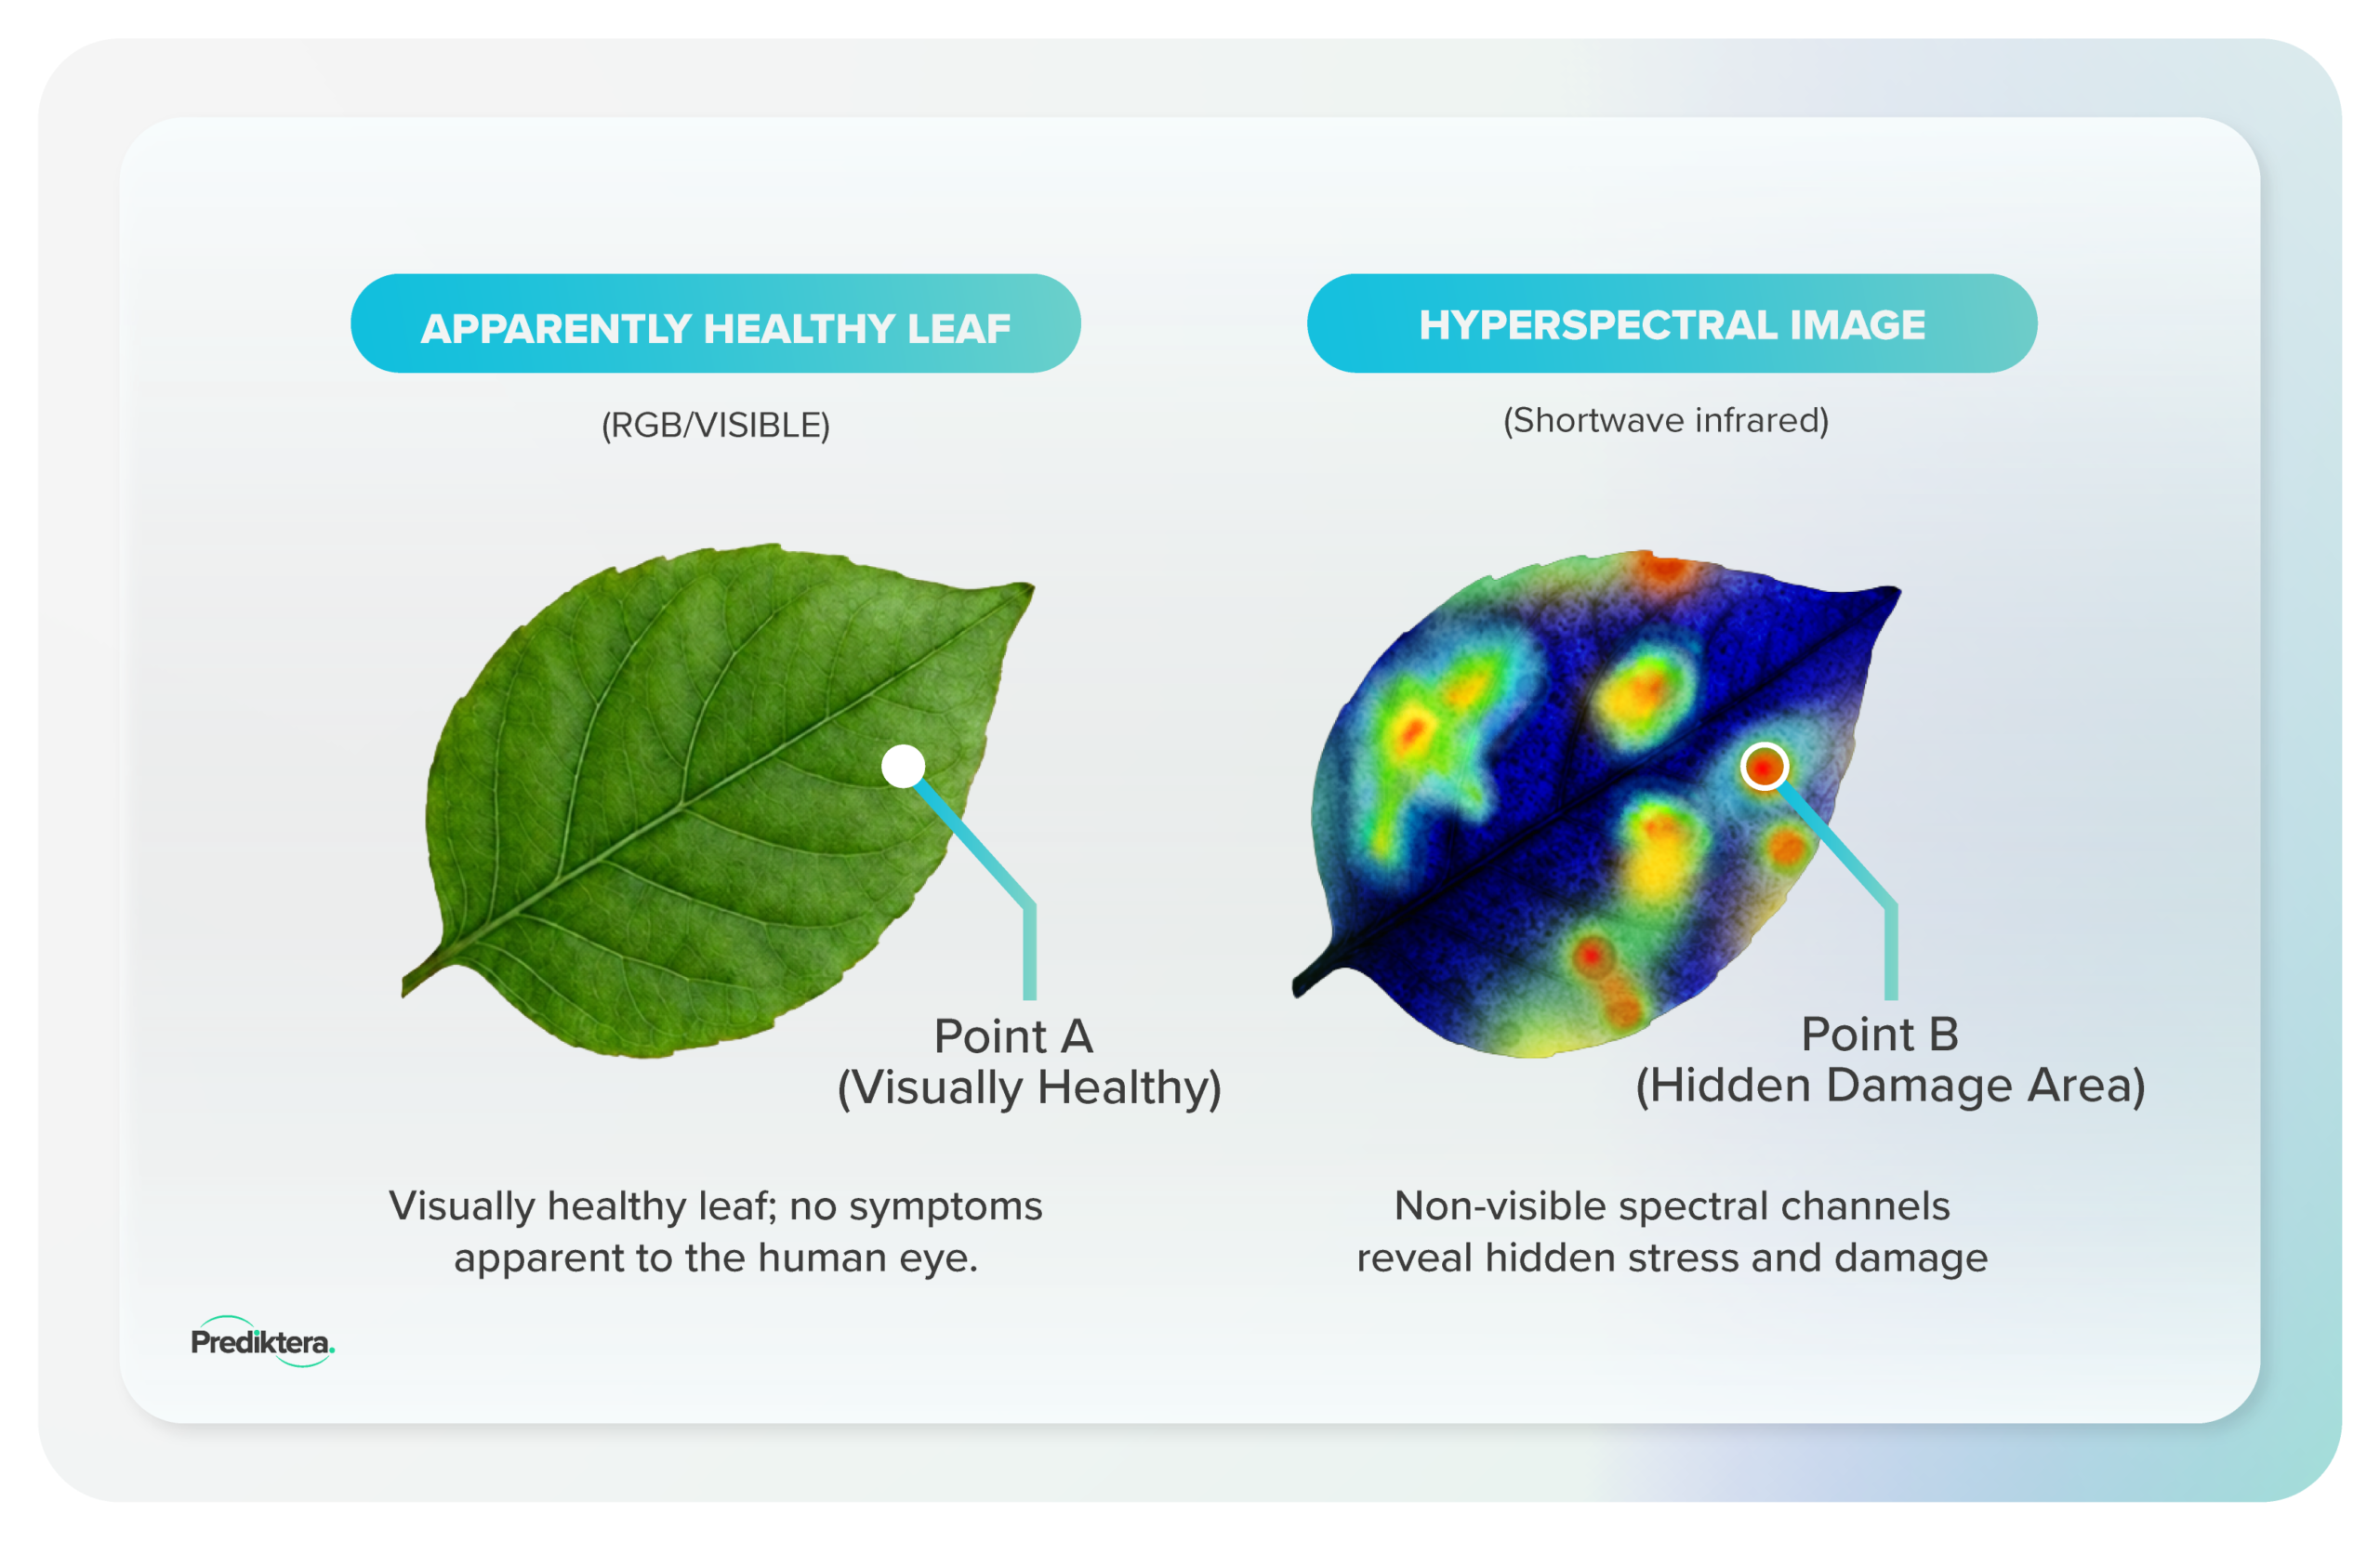
A visually healthy leaf next to its hyperspectral image, revealing hidden stress invisible in the RGB image.
The Hyperspectral Datacube
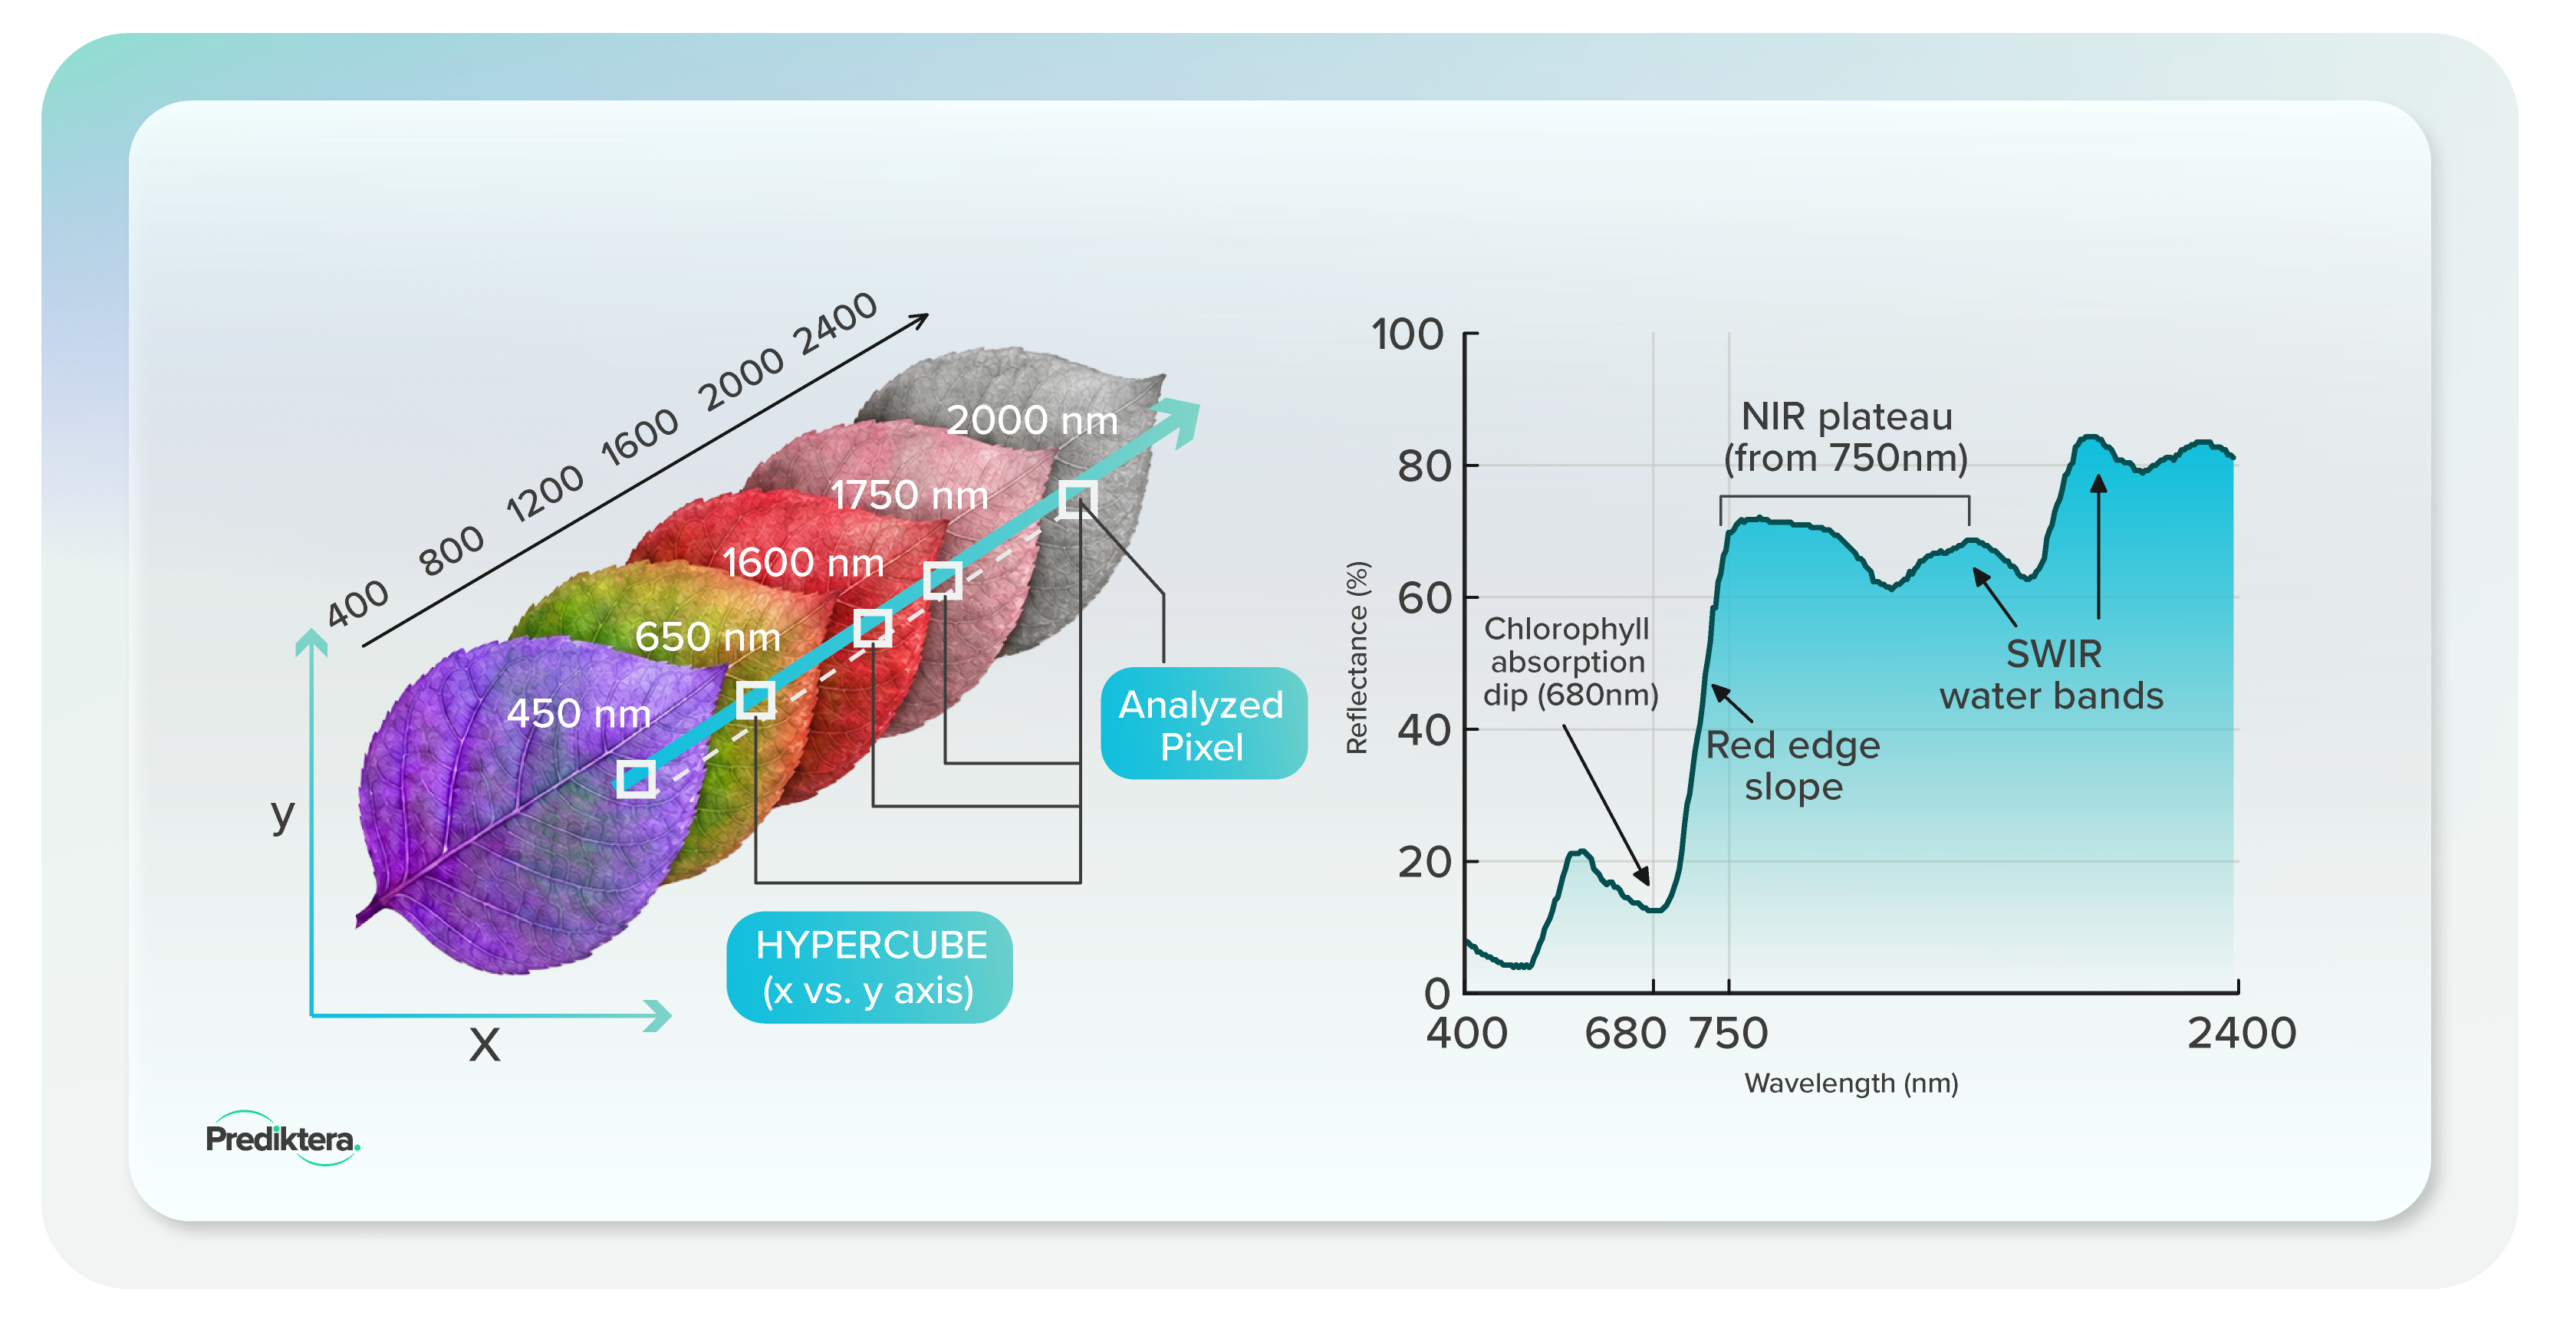
Unlike a traditional camera that captures only a few colour channels, a hyperspectral camera captures hundreds of spectral bands for every pixel in the image.
The result is a three-dimensional dataset known as a hyperspectral datacube, containing both spatial information (where something is) and spectral information (what it is made of). As the camera scans, it builds this cube line by line — stacking spectral data for every pixel until the full picture and its chemistry are captured together.
This is the same data structure Breeze Suite is built around — every tool in the platform, from visualization to AI modeling, works directly on the datacube.
Camera & Sensor Types
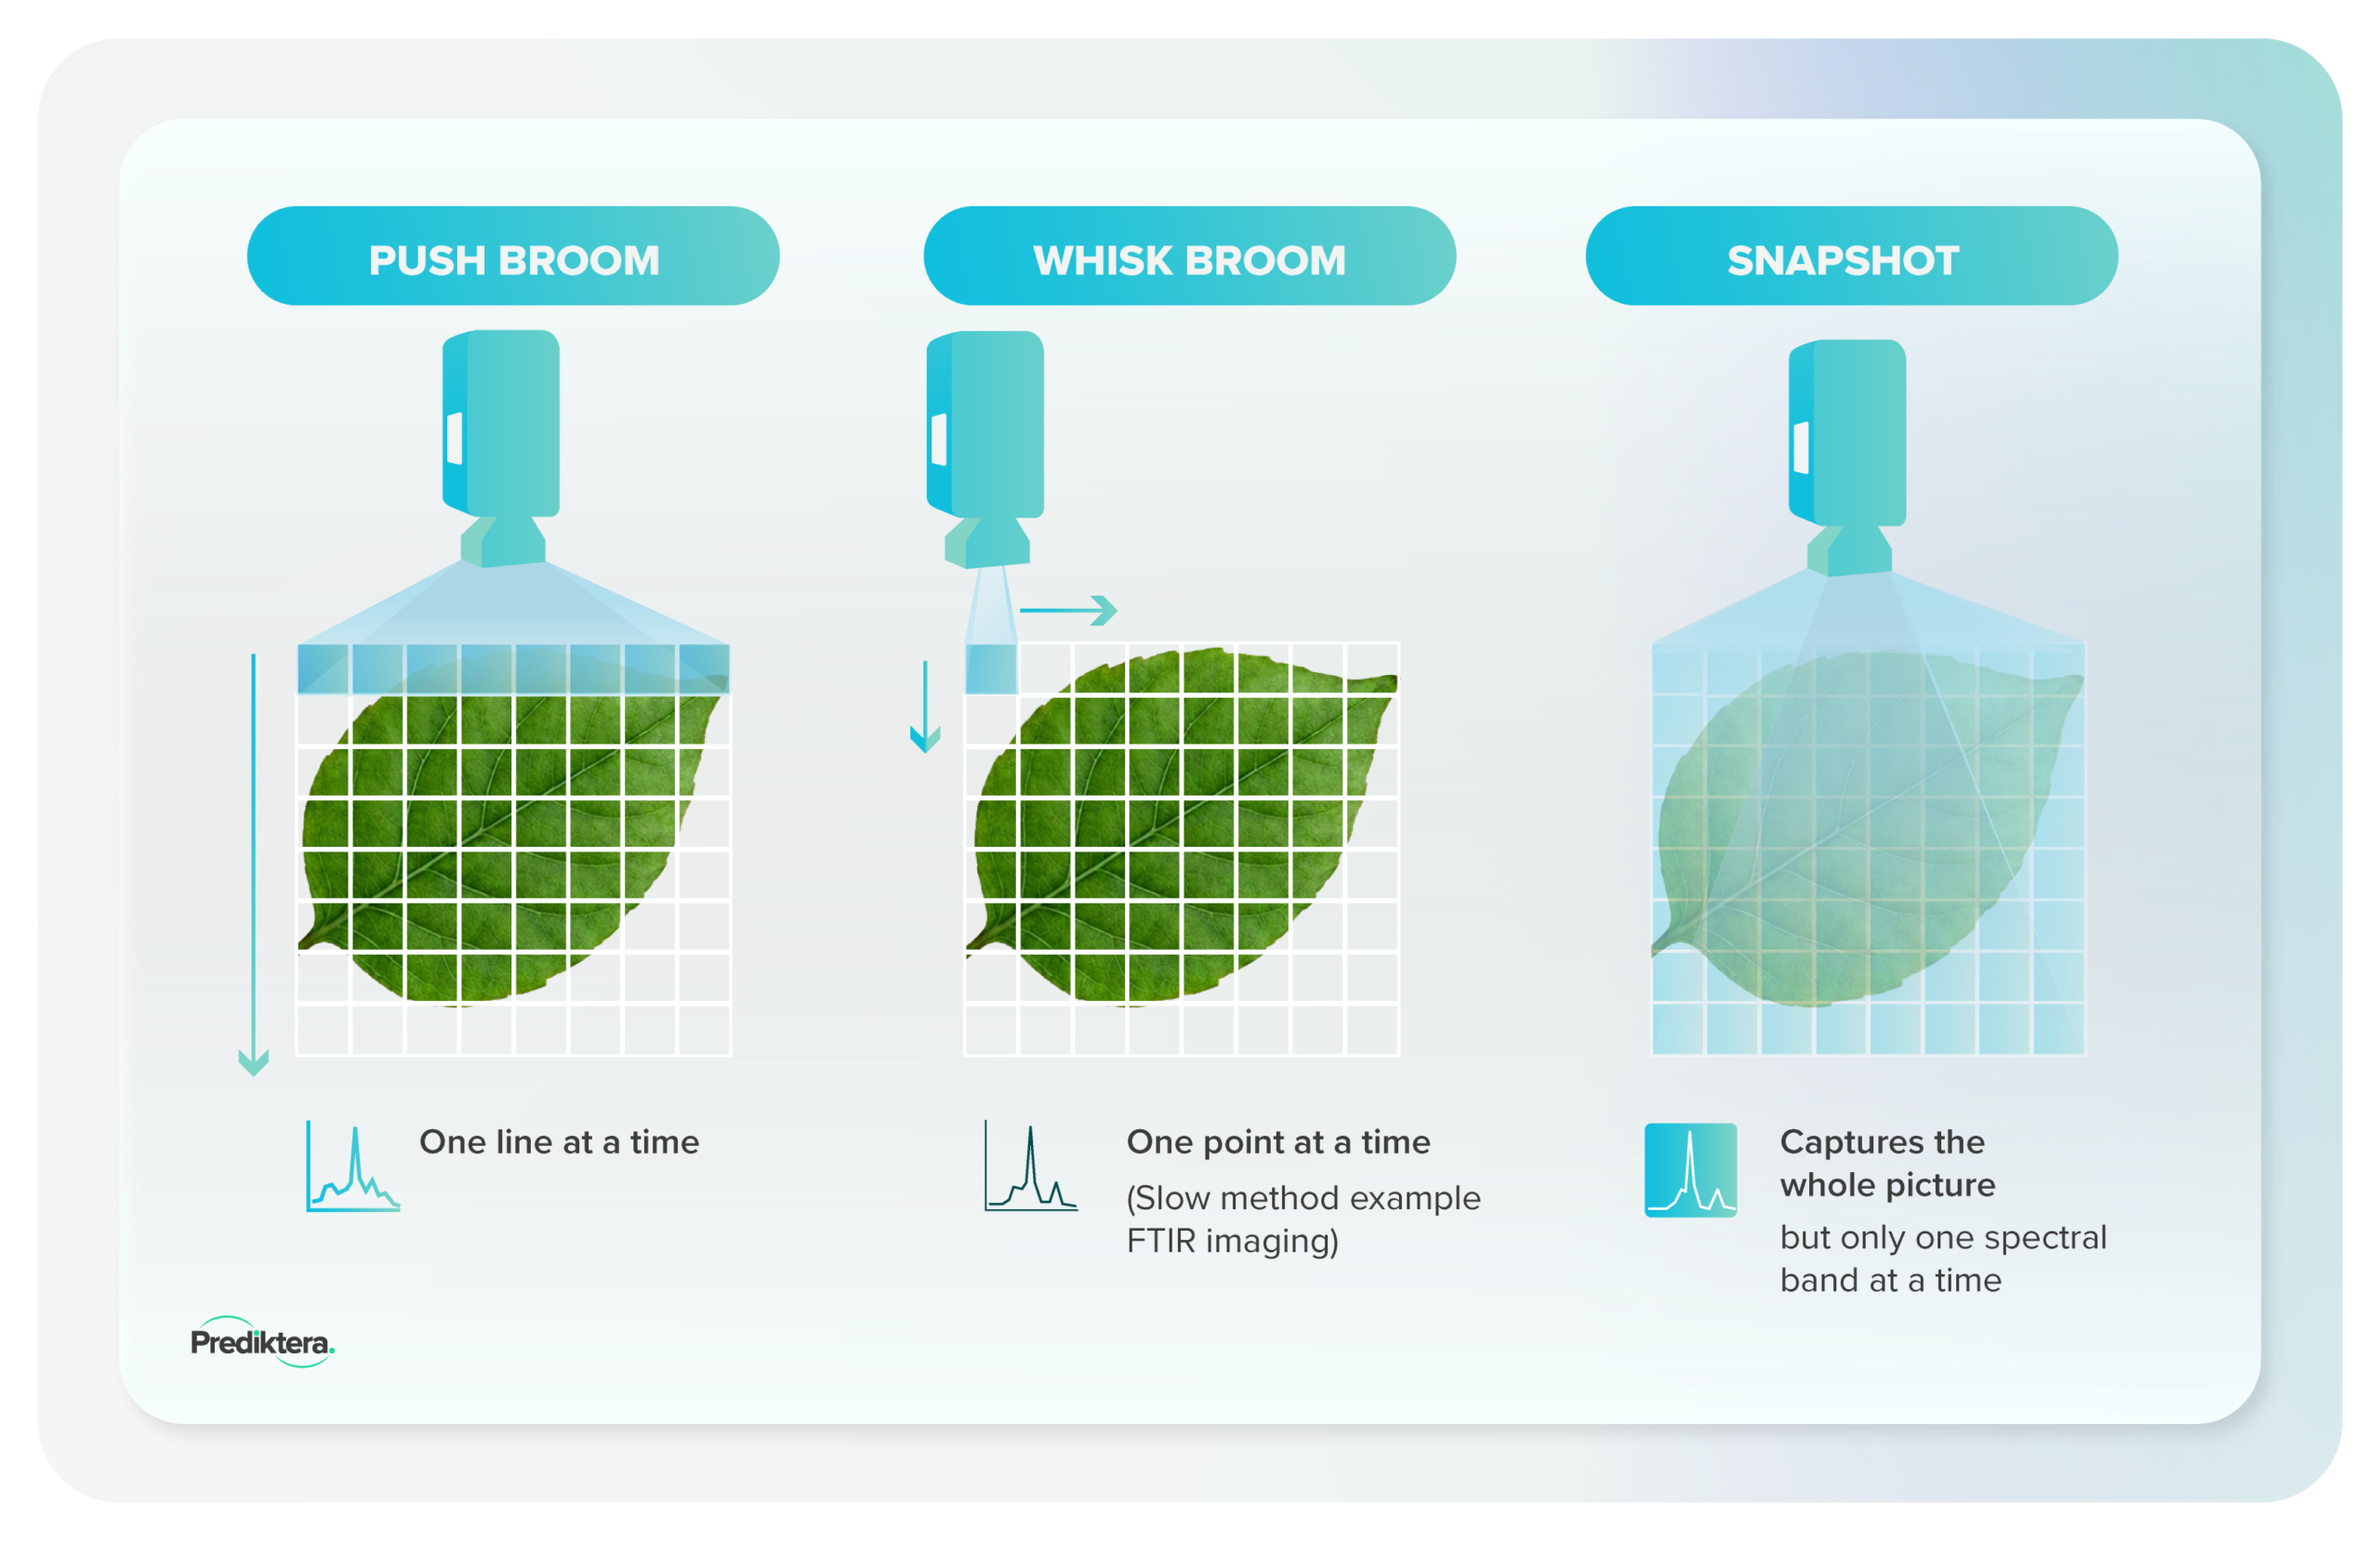
Different applications call for different types of hyperspectral cameras:
- Pushbroom (Line Scan): Scans one line of pixels at a time — the standard choice for conveyor belts and other continuous, moving production lines.
- Whiskbroom (Point Scan): Measures one point at a time. Slower and less common in industrial settings today, but still used in specialized lab and scientific instruments.
- Snapshot (Staring Scan): Captures the entire 3D datacube instantly, making it ideal for high-speed scenarios.
Choosing the Right Spectral Range
Different hyperspectral cameras are designed for specific spectral ranges and applications. The optimal choice depends on the materials being analysed, the information required, and budget considerations.
- VNIR (400–1000 nm): Commonly used for colour analysis, vegetation monitoring, and surface inspection.
- SWIR (1000–1700 nm): Often used for moisture measurement, food quality assessment, and material identification.
- eSWIR (1000–2500 nm): Provides deeper chemical information and is widely used for plastics sorting, pharmaceutical applications, and advanced material analysis.
- MWIR (3,000–5,000 nm) & LWIR (8,000–14,000 nm): Used for thermal inspection, gas detection, and specialized scientific applications.
Breeze Suite supports a wide range of hyperspectral camera systems and can combine data from multiple sensors when applications require information from different spectral ranges.
From Data to Decisions: The HSI Workflow
Capturing hyperspectral data is only the first step. To turn raw spectral information into useful results, a structured analysis workflow is required.
A typical hyperspectral imaging workflow includes:
- Data Acquisition — Capture hyperspectral images using the appropriate camera and lighting setup.
- Preprocessing — Convert raw sensor data into calibrated reflectance data and prepare it for analysis.
- Image Exploration & Annotation — Visualize spectral information, identify regions of interest, and label reference samples.
- Model Development — Build classification, quantification, or object detection models using chemometric and machine learning techniques.
- Validation — Evaluate model performance and optimize accuracy.
- Deployment — Apply models to new data for routine analysis, quality control, process monitoring, or automated decision-making.
Breeze Suite supports the entire workflow, from data exploration and model development to deployment and real-time analysis.
AI, Machine Learning & Chemometrics in HSI
What You Can Do With It
Hyperspectral imaging generates large volumes of data. To turn this data into useful information, advanced analytics and machine learning are used to identify patterns and relationships that would be difficult to detect manually.
Depending on the application, AI models can:
- Classify materials automatically — e.g., sort plastics by polymer type
- Detect contaminants and defects a camera alone would miss
- Quantify chemical properties — e.g., moisture, protein, or fat content
- Identify individual objects within a scene for object-level analysis
You don’t need a data science background to use any of this — Breeze Suite’s guided interface builds and validates these models for you.
Machine learning models can be used for both classification tasks, such as identifying materials and contaminants, and quantification tasks, such as predicting moisture, protein, fat, or chemical concentrations.
Methods at a Glance
| Method type | What it’s good for |
|---|---|
| Regression (PLS-R) | Predicting a concentration or measurement (e.g., % moisture) |
| Classification (PLS-DA, SIMCA) | Sorting materials into known categories |
| Machine Learning (Random Forest, SVM) | Handling more complex, non-linear patterns |
| Deep Learning (Neural Networks) | Tackling the hardest, most complex classification and detection tasks |
Breeze Suite provides access to a range of chemometric, machine learning, and deep learning methods through an intuitive graphical interface, while also offering Python integration for advanced users. Not sure which method fits your application? Breeze Suite’s guided workflow recommends the right approach — or our team can help you get started.

Applications Across Industries
Hyperspectral imaging is transforming quality control and monitoring across multiple sectors.
Food Processing
Detect contaminants, monitor product quality, and support automated inspection systems. Models developed in Breeze Suite can identify materials and quality deviations in real time.
Mining & Geology
Identify minerals, characterize surface materials, and support exploration and resource assessment — powered by Breeze Geo, our dedicated software for mineral and geological analysis.
Agriculture
Monitor crop health, assess growing conditions, and support yield prediction using airborne or drone-based hyperspectral imaging.
Recycling & Sorting
Differentiate materials based on their spectral signatures to improve automated sorting and waste recovery.
Remote Sensing
Analyse vegetation, water quality, land use, and environmental conditions using airborne and satellite-based hyperspectral imaging systems.
Pharmaceuticals
Verify raw materials, monitor processes, and assure quality — all without destroying the sample. Breeze Suite supports the validated, repeatable workflows pharmaceutical manufacturing requires.
Why Breeze Suite?
By combining chemometric methods, machine learning, and deep learning tools within a single environment, Breeze Suite helps users move from raw hyperspectral data to actionable insights faster.
- One platform, start to finish — from data acquisition to real-time deployment
- No coding required, with Python available for advanced users
- Supports a wide range of hyperspectral camera systems
- Built for both R&D and real-time industrial production
FAQ
What is hyperspectral imaging used for?
The data provided by hyperspectral imaging systems is used during industrial inspection to locate, sort, or quantify the concentration of various materials that are invisible to common cameras or the human eye. Common uses include identifying foreign contaminants in food processing, assessing moisture, waste sorting, precision agriculture, and mineral mapping.
What is the difference between hyperspectral and multispectral?
Multispectral imaging systems capture light using a limited number of discrete, separated wavebands—typically between 3 and 20. In contrast, hyperspectral imaging encompasses a much broader range of the electromagnetic spectrum, utilizing hundreds or even thousands of narrow, continuous wavebands to extract highly detailed chemical data.
How much does a hyperspectral camera cost?
Cost depends mainly on spectral range and camera type — a VNIR snapshot camera is far more affordable than a high-end SWIR or eSWIR pushbroom system. Rather than guessing, the fastest way to scope a system, and confirm it is compatible with Breeze Suite, is to talk to our team about your application.
What is a hyperspectral data cube?
A hyperspectral data cube (or hypercube) is the three-dimensional block of data acquired by the imaging system. Two of the dimensions represent the spatial information or the physical coordinates of the image, while the third dimension represents the spectral information (wavelengths), capturing a continuous spectral curve for every single pixel.
Is hyperspectral imaging real-time?
Yes, when combined with the proper data analysis tools. While raw hyperspectral imaging generates massive data volumes, platforms like Breeze Suite apply dimensionality reduction and machine learning to process this data instantly — enabling automated sorting and classification decisions on the fly.
Ready to see what you're missing?
Discover how our solutions can elevate your research and improve your processes. Whether you have questions or want a personalized demonstration of the software, we’re here to help!