Import your data
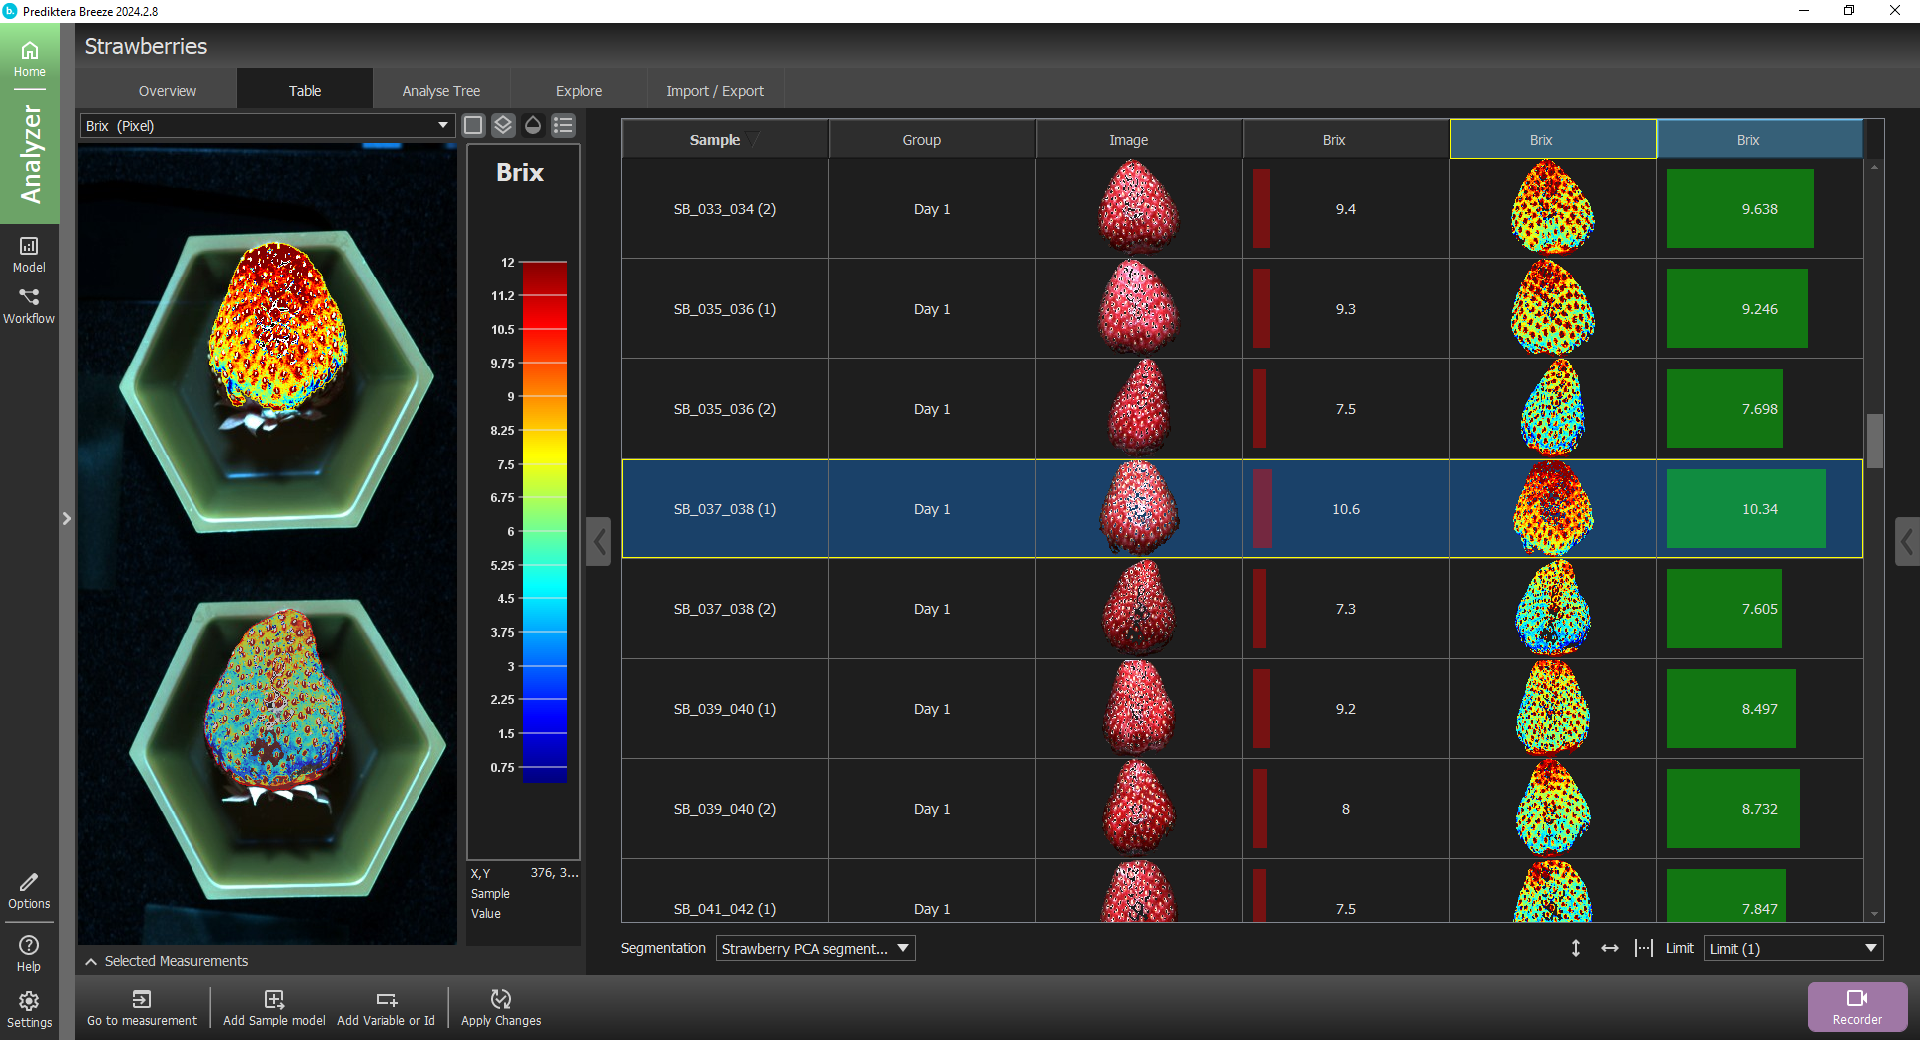
Open hyperspectral images and other spectral data for exploratory analysis.

Explore and model
Inspect images and spectra in linked visualisations and use multivariate tools to investigate patterns in your data.

Export your results
Export data and analysis results for further work.
Advanced Visualisations
Explore chemical information using spectral plots, histograms, line plots, and contour plots to uncover patterns in your data.
Interactive 2D & 3D Exploration
Investigate complex datasets with interactive scatter plots and rotatable 3D graphics to reveal relationships and variations.
Multivariate Modelling
Apply PCA, PLS, PLS-DA and SIMCA for exploratory analysis, classification and quantification.
Flexible Data Import & Export
Work with your data across different tools using common formats, including RAW, MAT, TIFF, XLS, and CSV.